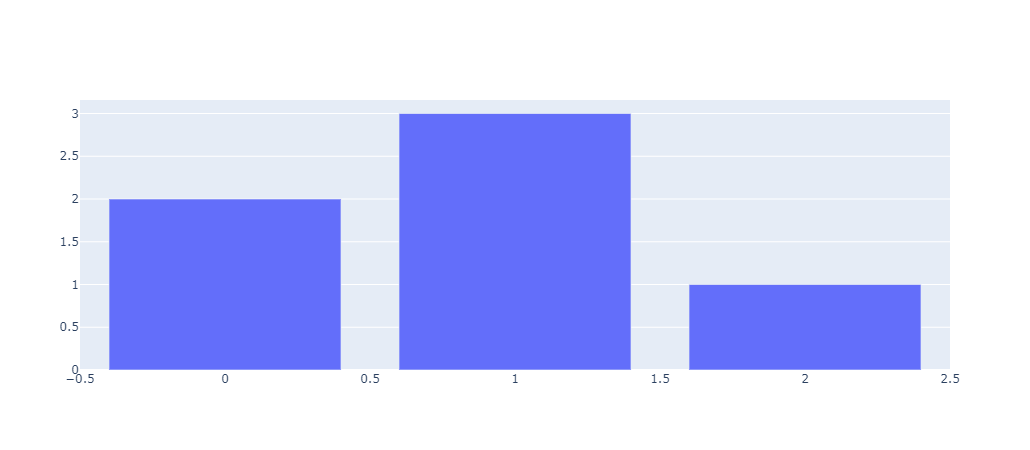
直接使用无法在 jupyter-notebook 中显示图窗,安装插件jupyterlab-plotly后可用。
安装[^ 1]
conda install nodejs
jupyter labextension install jupyterlab-plotly
使用
import plotly.graph_objects as go
fig = go.Figure(data=go.Bar(y=[2, 3, 1]))
fig.show()

本站文章除注明转载/出处外由 wguosh 创作,均为本站原创或翻译,采用 知识共享署名4.0 国际许可协议进行许可
转载前请务必署名
最后编辑时间为:2021-03-29 17:50:00
